Identifying Shrink with Visual Store Insights

A major nationwide supermarket wanted to understand how large shrink numbers were being created in one of the high footfall stores. As a high volume store, the shrink percentage was not considered excessive, but there was an opportunity to reduce shrink by visually highlighting the products and locations contributing to the losses, as well as reviewing the Loss Prevention efforts in store.
REQUIREMENT
A supermarket chain wanted to understand the details behind the shrink within a high volume store:
- What products were being lost and from where
- The hypothesis was that majority of loss was from opportunistic theft – convenience food/drink items
- RGIS already provided inventories and surveys so it was an ideal opportunity to combine services for a focus project
SOLUTION
With a variety of stakeholders interested in shrink, RGIS implemented the following:
- A ‘focus store’ count project
- The store had a full mapping survey to validate store fixtures/fittings as preparation
- The store then had weekly counts over a six week period
- A change to the count program/process to identify where on the bay the SKU was located
- The store was observed for other security measures such as security staff location, camera location and open checkouts
- A consistent team of auditors were used each week
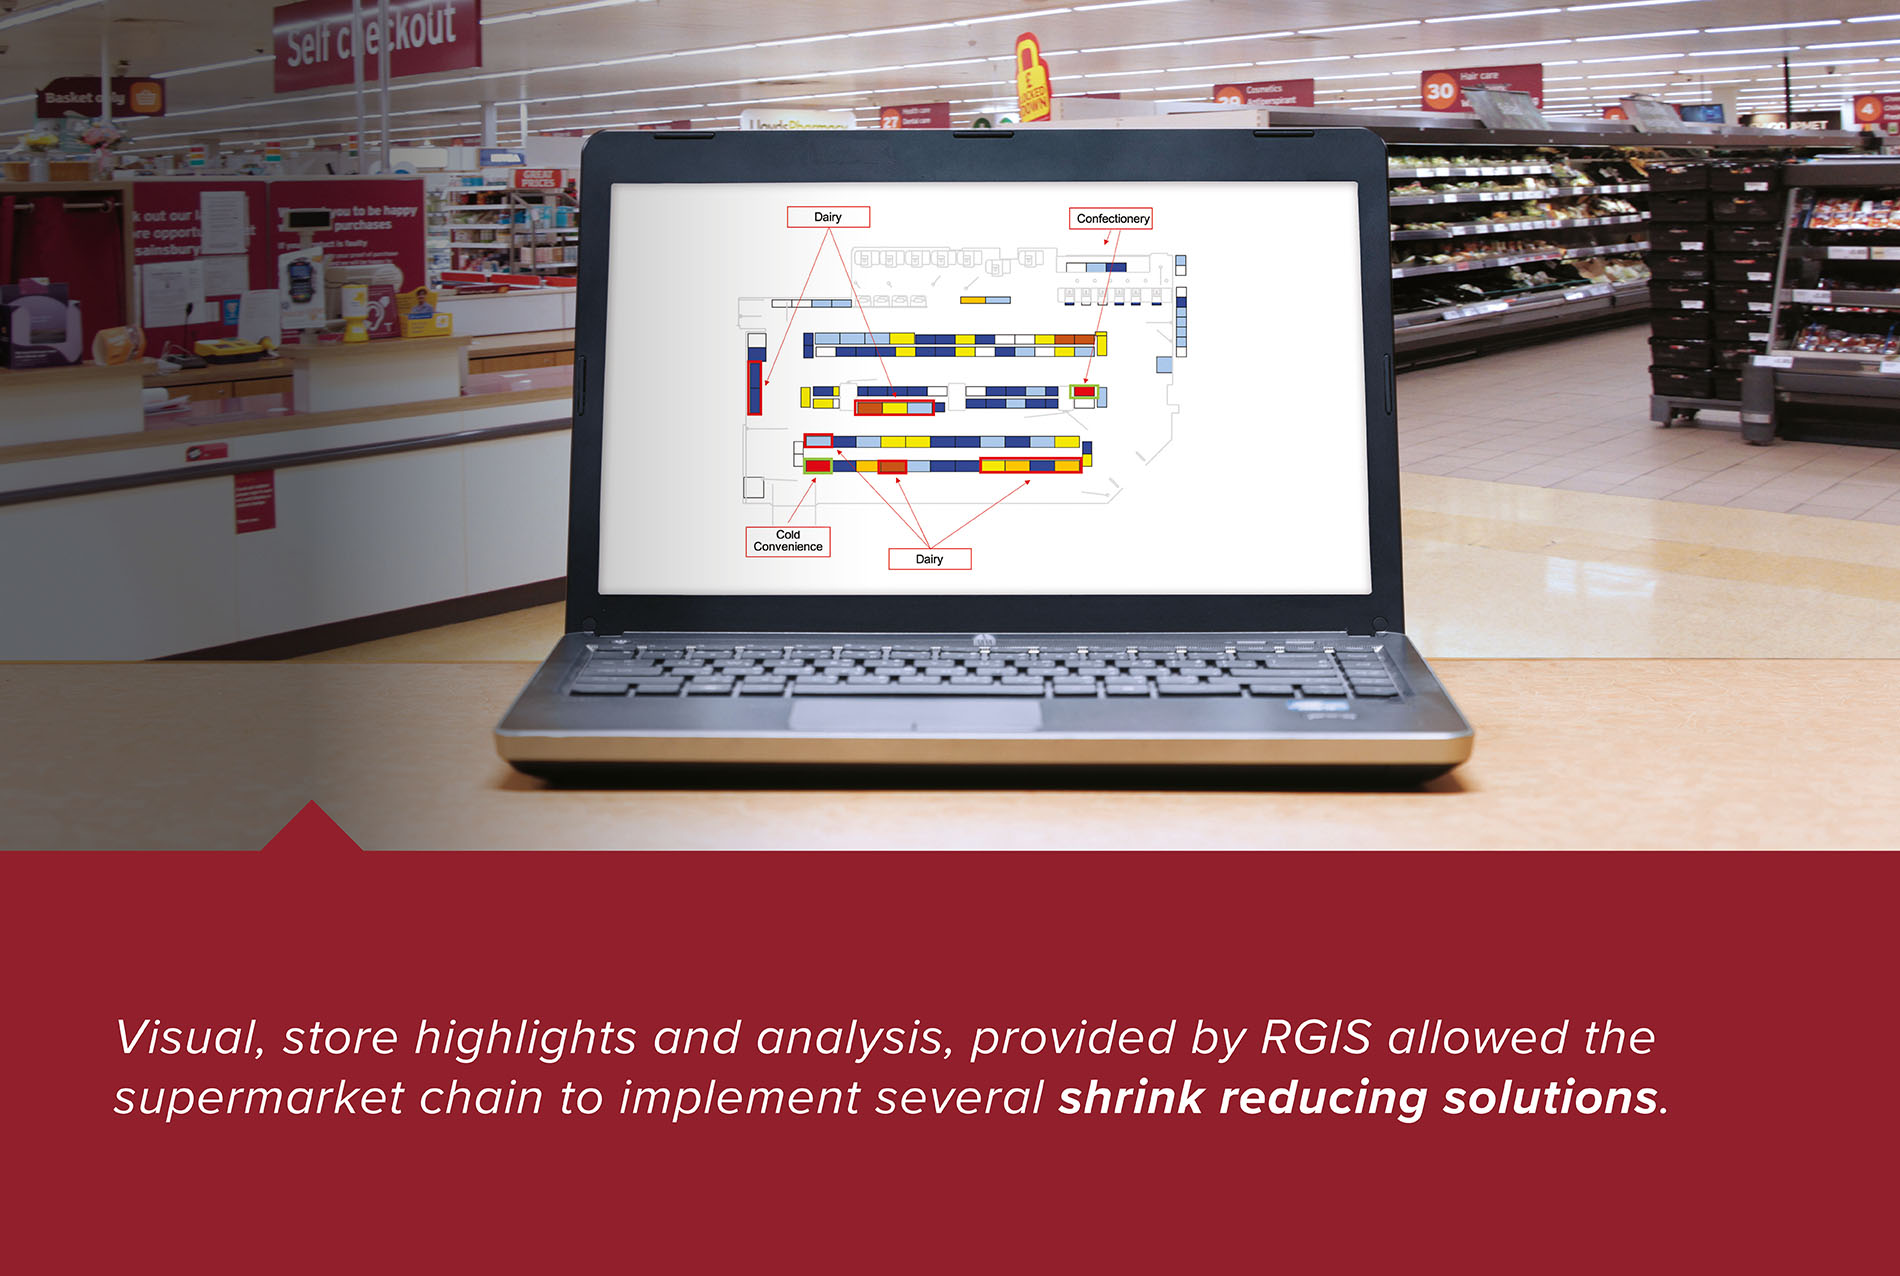
- Visual Store Insight (VSI) was used to visualise the results and heat-map the losses
- The count variance data was combined with Sales, Deliveries and Store Adjustments for further analysis
- Findings were delivered using a data driven summary report and VSI as an interactive tool for discussion with multiple stakeholders
RESULTS
By having the numbers supported by visual representation of the store, it was easy to identify what SKUs were seeing consistent losses each week. This visibility enabled the supermarket chain to implement a number of changes to combat losses:
- Security gate added to front door
- Security guard hours were doubled
- Cameras were updated to 360 degree, and locations were changed
- ‘Grab & Go’ items identified as target area for improvement
- A post trial count reported a reduction in losses from the shop floor for high value, targeted theft items